
GAUSS Eval: Human–LLM Judge Consistency Analysis
TL;DR
We present a comprehensive statistical analysis of the consistency between human and Large Language Model (LLM) judges in evaluating proof-based mathematical problems, benchmarking 14 state-of-the-art models on the MathArena USAMO 2025 dataset. By decomposing judgment behavior through error-accuracy, correlation, and distributional metrics, we show that top performing models exhibit distinct grading philosophies - DeepSeek-Math-V2 grades strictly, Gemini-3-Pro is precise on partially correct problems, and GPT-5 demonstrates balanced performance. We further identify a consistent "leniency bias", whereby most models over-credit structurally plausible yet mathematically flawed solutions. Our analysis further demonstrates that LLM judges produce significantly higher entropy score distributions than humans and struggle with local verification, often hallucinating logical bridges rather than penalizing omitted justifications. We hope our findings will help the community understand LLM-as-a-judge and math reward models better.
Figure 1. Benchmarking LLM graders on MathArena USAMO 2025.
Links
- Full report: gaussmath.ai/assets/eval.pdf
- Run logs: Google Drive log link
1. Introduction
Large Language Models (LLMs) are increasingly used not only to solve mathematical problems, but also to judge them — grading long-form, proof-style responses produced by humans or other models.
Yet a fundamental question remains:
Can an LLM judge math problem answers like a human does?
This report presents a comprehensive statistical analysis of human–LLM grading consistency. It investigates how current LLM judges align or diverge from human grading standards across key statistical dimensions.
The analysis decomposes judgment behavior into layered diagnostics to reveal not only whether LLM judges agree with humans, but also how and why their scoring behavior differs across distinct validity and difficulty regimes.
Our analysis reveals a clear performance pattern across current LLM judges.
Specifically, GPT-5 and GPT-5-Pro exhibit the strongest alignment with human judges among closed-source models, whereas DeepSeek-Math-V2 and Kimi-K2-Thinking constitute the most reliable and human-aligned judges within the open-source models.
However, despite these encouraging aggregate trends, all existing models still exhibit substantial limitations in fine-grained evaluative accuracy. These observations also point directly to our next research direction: strengthening LLMs’ ability to evaluate mathematical reasoning at a local level. In particular, future judge models need to:
- more accurately verify the correctness of specific argument steps, rather than relying on global coherence;
- more reliably identify missing or skipped reasoning, avoiding the tendency to implicitly fill in gaps.
Taken together, these goals aim to move beyond coarse approximation and toward LLM judges that analyze mathematical work with human-level granularity and rigor.
2. Problem Formulation
2.1 Grading Proof-based Problems
Given a mathematical problem , a candidate solution , and the rubric , the grading process for proof-based problems can be formalized as a scoring function:
where can be either a human grader or an LLM grader, and represents the scoring space corresponding to the given rubric. In this work, we follow the USA Mathematical Olympiad (USAMO) rubric where .
2.2 Evaluation Desiderata
We leverage three sets of metrics to evaluate LLM graders. We first introduce standard error-accuracy metrics for LLM graders. We then present correlation metrics and distributional metrics for more fine-grained analysis.
2.2.1 Error–Accuracy Metrics
Error–accuracy metrics quantify the deviation between model predictions and ground-truth values on a per-example basis. They directly measure how close the predictions are to the correct outputs.
Given ground-truth targets and model predictions , we consider:
Mean Absolute Error (MAE).
Mean Squared Error (MSE).
Root Mean Squared Error (RMSE).
Accuracy Within .
For regression or ordinal prediction tasks, accuracy within measures the proportion of predictions whose absolute error does not exceed a tolerance threshold :
This metric gives a flexible notion of correctness by allowing predictions to be considered correct if they fall within an acceptable error margin.
2.2.2 Correlation Metrics
Correlation metrics assess the degree to which model predictions preserve the trend or ordering of the ground-truth data, largely independent of scale.
Pearson Correlation Coefficient.
Spearman Rank Correlation Coefficient.
Let be the difference between predicted and true ranks. Then
Coefficient of Determination ().
In an ordinary least squares (OLS) linear regression model, the R2R^2R2 score measures the fraction of variance in the response variable explained by the fitted model. Let
Then
Higher values indicate better explanatory power of the linear model.
2.2.3 Distributional Metrics
Distributional metrics evaluate how well the predicted distribution matches the empirical distribution of the ground truth. They characterize global distributional properties such as divergence, uncertainty, and variability.
Let be the true distribution and the model distribution.
Entropy Ratio.
Relative Variance.
When comparing two distributions,
3. Key Findings
We present four major findings on LLM-as-a-judge performance on MathArena USAMO 2025. We begin with overall model benchmarking and distributional analysis in §3.1 and §3.2. We then examine how models behave differently on zero versus non-zero scored solutions in §3.3, and how grading precision varies across individual problems in §3.4.
3.1 Benchmark LLM-as-a-Judge
We begin our analysis by providing a primary ranking of the 11 models (see Figure 1 and Tables 1, 2, 3). Across all three evaluation dimensions, GPT-5 consistently ranks as the top overall model, achieving the best average rank in both error–accuracy and alignment metrics (1st, Tables 1, 2) while remaining highly competitive on distributional metrics (3rd, Table 3).
We observe that numerical accuracy alone does not fully capture the models' grading capabilities: while 4 models (GPT-5, Kimi-K2-T, GPT-OSS-120B, Qwen3-Max) achieve top-tier accuracy (0.61), their mean absolute errors vary substantially (from 0.79 to 1.22).
Interestingly, although GPT-5-Pro and Qwen3-235B-A22B-Thinking consume more inference-time compute, they do not perform as well as their counterparts with less reasoning effort (GPT-5 and Qwen3-235B-A22B-Instruct).
We begin our analysis by benchmarking the 14 models (see Figure 1 and Tables 1, 2, 3)
DeepSeek-Math-V2 emerges as the best overall model, achieving the lowest MAE (0.67), highest accuracy (0.73), and competitive Pearson correlation (0.62). This suggests it excels at precise numerical predictions. GPT-5, GPT-5-Pro, and Gemini-3-Pro form a cluster of high-performing models with MAE values below 1.0, accuracy around 0.56–0.64, and Pearson correlations of 0.74–0.75. These models balance well across all metrics.
We observe that numerical accuracy alone does not fully capture the models' grading capabilities: while 4 models (GPT-5, Kimi-K2-T, GPT-OSS-120B, Qwen3-Max) achieve high accuracy (0.61), their mean absolute errors vary substantially (from 0.79 to 1.22).
Interestingly, although GPT-5-Pro and Qwen3-235B-A22B-Thinking consume more inference-time compute, they do not perform as well as their counterparts with less reasoning effort (GPT-5 and Qwen3-235B-A22B-Instruct).
3.2 LLM Grades More Diversely than Human
Figure 2. Distributional metrics on MathArena USAMO 2025.
The global distributional pattern (Figure 2, Table 3) reveals a systematic expansion in both entropy and variance across all models. Modern LLMs no longer produce narrowly concentrated score distributions; instead, they exhibit broader and more expressive grading behavior compared with human judges.
DeepSeek-Math-V2 behaves exceptionally good in these two metrics with closer to 1 value on ER (entropy ratio) and RV (relative variance).
Except that, all models demonstrate elevated ER (entropy ratio) values (typically in the range 1.6–2.0) (Figure 2 Left), indicating a clear increase in information entropy relative to the human reference. This suggests that model scoring has become less concentrated and more exploratory, assigning probability mass across a wider range of plausible evaluations.
The RV (relative variance) values (mostly between 1.3–1.9) (Figure 2 Right) confirm a consistent expansion in score variance. Compared with human judges, models tend to exaggerate contrasts between good and bad answers, displaying a mild but systematic over-dispersion bias.
3.3 LLM Gives Lenient Grades
Figure 3. Confusion Matrices of 3 Models and Human Baseline. Non-integer scores are rounded to the nearest even integer. A confusion matrix is a table where each cell is the frequency with which a sample rated by humans receives a score from the model.
Figure 4. MAE vs. Accuracy on MathArena USAMO 2025.
LLMs exhibit systematic leniency bias when grading mathematical solutions.
The confusion matrices in Figure 3 reveal that the lower-right triangles (where LLMs assign higher grades than humans) are consistently denser than the upper-left triangles (where LLMs assign lower grades). This indicates that models systematically over-credit solutions relative to human expert judgment.
This leniency, however, manifests differently depending on solution quality. USAMO problems are exceptionally difficult, with most LLM solutions receiving human grades of 0. This creates a natural partition for analyzing how graders behave on zero-scored versus non-zero-scored solutions, revealing nuanced patterns in LLM grading behavior.
Performance Divergence: Zero vs. Non-Zero Solutions
LLM graders show contrasting performance patterns across these two subsets (see Figure 4):
- Human Score = 0: Models achieve higher accuracy but higher MAE compared to their performance on the full dataset.
- Human Score > 0: The pattern reverses—accuracy drops while MAE improves.
This divergence reflects fundamental differences between the two metrics:
MAE (Mean Absolute Error) measures numerical proximity to human scores.Accuracy captures categorical correctness (i.e., exact score band matching).
On non-zero solutions, models track human scores more closely on average, producing smaller numerical deviations and lower MAE. However, the non-zero score distribution is denser and more granular—distinguishing among 3, 4, 5, or 6 points rather than simply 0 versus non-zero. This makes band misclassification more likely even with small numerical errors, thereby reducing accuracy.
Model-Specific Grading Philosophies
Individual models exhibit distinct grading philosophies:
- DeepSeek-Math-V2: Grades exceptionally strictly.
- Achieves the best performance on the Human = 0 subset (10% higher accuracy than the second-best model).
- Shows poor performance on Human > 0.
- Result: Since MathArena-USAMO2025 is heavily skewed (80% of samples receive human grades of 0), DeepSeek-Math-V2's strict grading style makes it the best-performing model overall.
- Gemini Family (3-Pro & 2.5-Pro): Shows the opposite pattern.
- Rank as the top two models on the Human > 0 subset.
- Underperform on the Human = 0 subset.
- GPT-5: Demonstrates balanced performance across both subsets, though it still exhibits the general leniency bias observed across all models.
3.4 Grading Precision Correlated with Problems
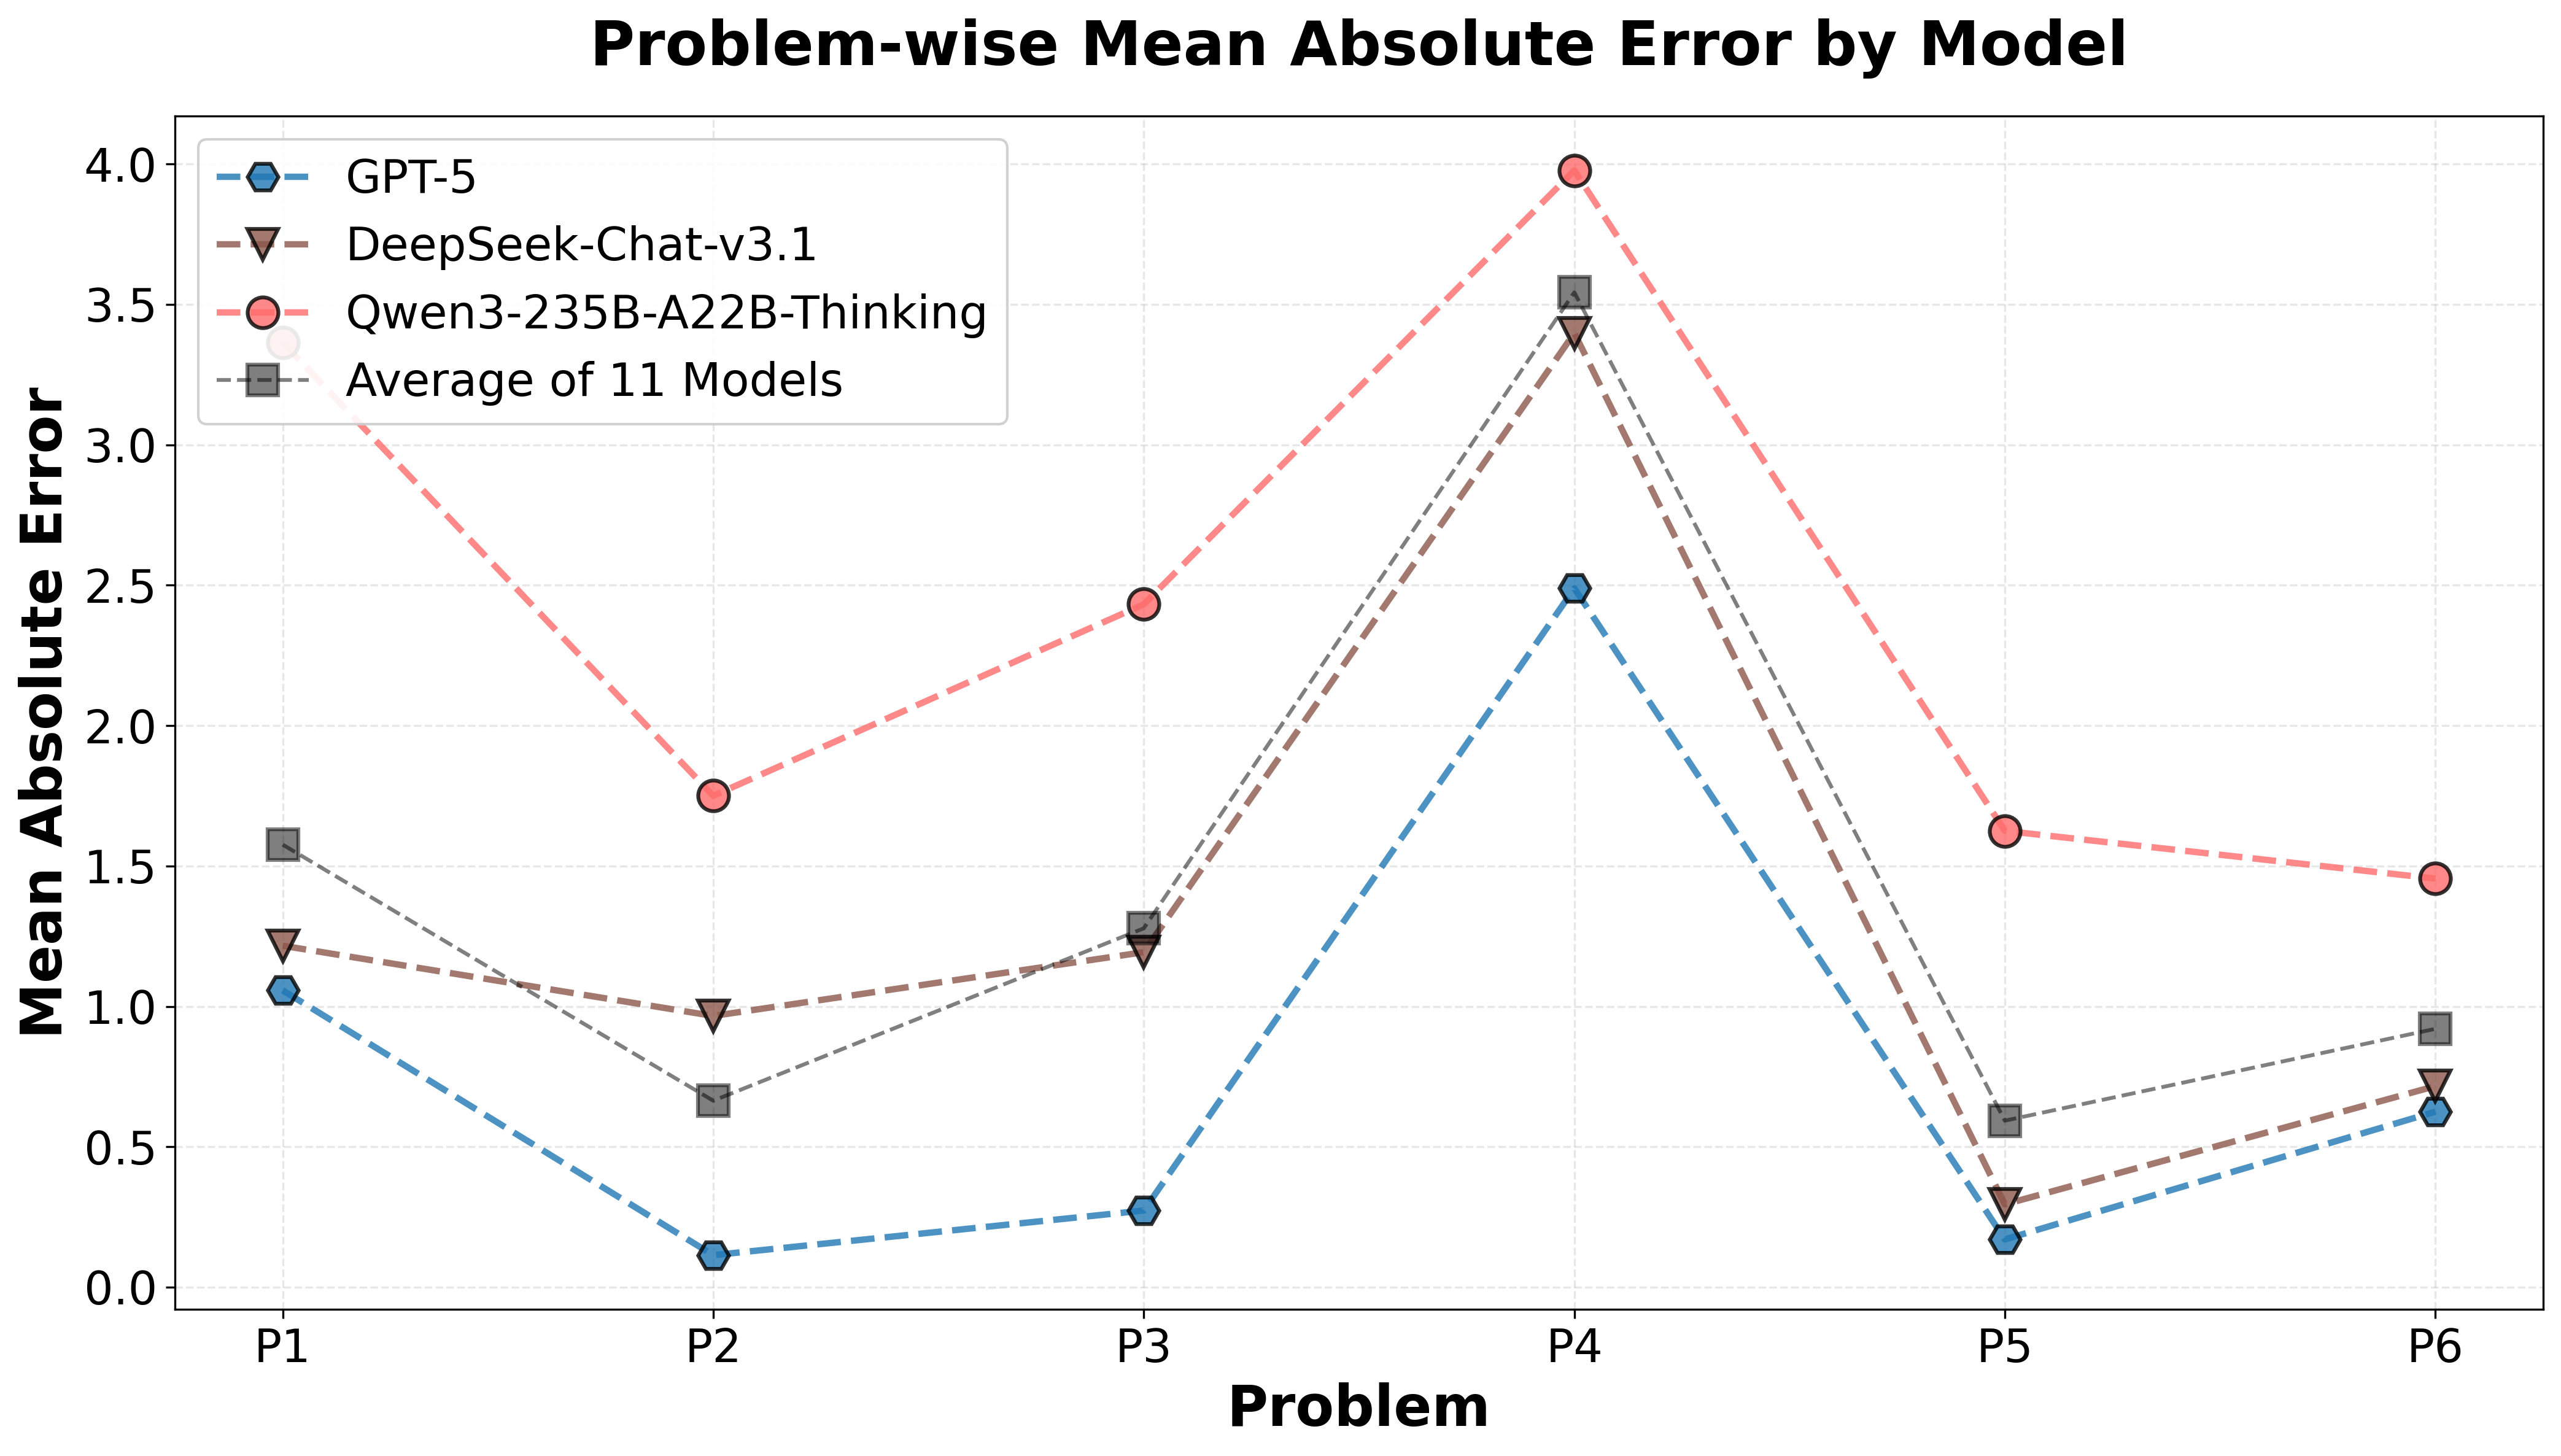
Figure 5. Problem-wise Mean Absolute Error.
Beyond the systematic leniency bias observed above, LLM grading performance also exhibits strong problem-dependent variation. LLM grader precision varies considerably across problems (see Figure 5). Remarkably, models of vastly different overall ranks in Table 1 (2st, 9th, 14th) exhibit nearly identical problem-wise performance patterns: strong grading precision on P2, P3, and P5, but consistently weaker performance on P4. This pattern becomes even more pronounced in Table 5, where top models (GPT-5, GPT-OSS-120B, Kimi-K2-Thinking) achieve near-perfect accuracy (>0.80) on P2, P3, and P5, yet all struggle with P4.
This problem-specific difficulty is independent of the zero-score pattern analyzed in §3.3. We verify that P4's grading difficulty does not correlate with the proportion of zero-scored solutions—in fact, according to human graders, P4 has the second-highest average score and second-fewest zero grades among all problems, suggesting models struggle with P4 despite (or perhaps because of) its solutions containing substantial mathematical reasoning.
4. GPT-5 Case Study
We conducted a granular analysis of GPT-5 across 264 solutions.
- The Good: Globally, GPT-5 aligns well with human judgment (Pearson correlation of 0.746). For coarse-grained evaluation, it is highly effective, with 91.7% of its predictions falling within points of the human score.
- The Bad: The model struggles significantly with zero-score discrimination. It assigned non-zero credit to 28% of responses that humans judged completely invalid.
- The "Degenerate" Case (Problem 2): On Problem 2, GPT-5 achieved near-perfect accuracy but a correlation () of nearly zero. This occurred because human scores had almost no variance (most students got zero). GPT-5 learned to predict the mode (zero) to minimize error, but failed to explain any meaningful variation in the few non-zero answers.
4.1 Two Main Failure Modes
Detailed case studies of Problem 1 and Problem 4 reveal why GPT-5 diverges from human graders. The model tends to grade based on plausibility and surface structure rather than strict logical correctness.
Problem 1: The "Over-Completion" of Proofs
In this case, a student submitted a solution with decisive logical gaps—omitting required justifications for floor/mod transformations and bounds.
- Human Score: 1/7. Humans grade strictly on what is written.
- GPT-5 Score: 5/7. GPT-5 implicitly "repaired" the invalid steps.
- The Cause: The model rewarded the student for having a promising idea ("conceptual intent") and hallucinated the intermediate steps required to make the proof work. It treated vague statements like "easy induction" as valid proofs, whereas humans required the work to be shown.
Problem 4: Rewarding Plausible but Incorrect Reasoning
In this geometry problem, a student provided a solution full of unproven claims, incorrect statements, and assumed identities.
- Human Score: 0/7. The student failed to establish the necessary properties.
- GPT-5 Score: 3/7. The model was fooled by the "math-sounding" nature of the text.
- The Cause: GPT-5 treated plausible intermediate statements (like collinearity or power-of-a-point expressions) as if they had been proven, even when the derivation was missing or wrong. It failed to locally verify the correctness of each step, preferring to reward the coherent "shape" of the argument.
4.2 Conclusion
GPT-5 acts as a capable but systematically biased math judge. It is well-suited for large-scale, approximate alignment with human scoring. However, it is not yet a reliable substitute for strict evaluation because it cannot distinguish between a correct derivation and a plausible-looking gap.
We leave the full scale analysis in Section 4 of our full report.
5. Statistics
In this section, we present tables of empirical statistics for reference.
Table 1: Error–Accuracy Metrics
| Model | MAE | RMSE | Acc. | Acc.≤1 | Acc.≤2 |
|---|---|---|---|---|---|
| DeepSeek-Math-V2 | 0.67 | 1.68 | 0.73 | 0.88 | 0.91 |
| GPT-5 | 0.79 | 1.67 | 0.61 | 0.81 | 0.92 |
| Gemini-3-Pro-Preview | 0.89 | 1.87 | 0.64 | 0.80 | 0.88 |
| Kimi-K2-Thinking | 0.97 | 1.98 | 0.61 | 0.80 | 0.87 |
| GPT-5-Pro | 0.90 | 1.74 | 0.56 | 0.78 | 0.89 |
| GPT-OSS-120B | 1.06 | 2.15 | 0.61 | 0.78 | 0.85 |
| GPT-5.1 | 1.04 | 2.03 | 0.56 | 0.78 | 0.86 |
| Qwen3-Max | 1.22 | 2.38 | 0.61 | 0.74 | 0.81 |
| DeepSeek-Chat-v3.1 | 1.30 | 2.42 | 0.54 | 0.74 | 0.79 |
| Gemini-2.5-Pro | 1.32 | 2.35 | 0.52 | 0.72 | 0.79 |
| Qwen3-235B-A22B | 1.39 | 2.41 | 0.49 | 0.70 | 0.78 |
| Qwen3-32B | 2.19 | 3.31 | 0.39 | 0.56 | 0.64 |
| DeepSeek-R1 | 2.20 | 3.41 | 0.43 | 0.56 | 0.64 |
| Qwen3-235B-A22B-Thinking | 2.45 | 3.66 | 0.36 | 0.56 | 0.63 |
Table 2: Correlation Metrics
| Model | Pearson | Spearman | Kendall | κ_lin | κ_quad | Slope | Intercept | R² |
|---|---|---|---|---|---|---|---|---|
| GPT-5 | 0.75 | 0.58 | 0.53 | 0.57 | 0.70 | 0.86 | 0.76 | 0.56 |
| Gemini-3-Pro-Preview | 0.74 | 0.58 | 0.53 | 0.55 | 0.67 | 0.93 | 0.90 | 0.55 |
| GPT-5-Pro | 0.74 | 0.55 | 0.50 | 0.53 | 0.69 | 0.86 | 0.89 | 0.55 |
| GPT-5.1 | 0.70 | 0.58 | 0.53 | 0.50 | 0.62 | 0.88 | 1.08 | 0.49 |
| DeepSeek-Math-V2 | 0.62 | 0.50 | 0.47 | 0.52 | 0.62 | 0.61 | 0.37 | 0.39 |
| Kimi-K2-Thinking | 0.63 | 0.46 | 0.42 | 0.48 | 0.60 | 0.75 | 0.88 | 0.40 |
| GPT-OSS-120B | 0.62 | 0.51 | 0.46 | 0.47 | 0.56 | 0.78 | 1.04 | 0.39 |
| Qwen3-Max | 0.61 | 0.47 | 0.43 | 0.44 | 0.52 | 0.81 | 1.23 | 0.37 |
| Gemini-2.5-Pro | 0.61 | 0.46 | 0.41 | 0.41 | 0.52 | 0.77 | 1.39 | 0.37 |
| DeepSeek-Chat-v3.1 | 0.60 | 0.45 | 0.41 | 0.42 | 0.51 | 0.80 | 1.33 | 0.36 |
| Qwen3-235B-A22B | 0.54 | 0.44 | 0.39 | 0.36 | 0.47 | 0.67 | 1.40 | 0.30 |
| Qwen3-32B | 0.47 | 0.40 | 0.35 | 0.26 | 0.32 | 0.67 | 2.36 | 0.22 |
| Qwen3-235B-A22B-Thinking | 0.44 | 0.39 | 0.34 | 0.23 | 0.28 | 0.66 | 2.66 | 0.19 |
| DeepSeek-R1 | 0.41 | 0.35 | 0.31 | 0.25 | 0.28 | 0.60 | 2.38 | 0.17 |
| Human Baseline | 0.99 | 0.94 | 0.92 | 0.95 | 0.99 | 1.00 | 0.01 | 0.98 |
Table 3: Distributional Metrics
| Model | ER | JSD | RV |
|---|---|---|---|
| DeepSeek-Math-V2 | 1.13 | 0.02 | 0.95 |
| GPT-OSS-120B | 1.68 | 0.06 | 1.55 |
| Gemini-3-Pro-Preview | 1.61 | 0.07 | 1.57 |
| Kimi-K2-Thinking | 1.68 | 0.07 | 1.39 |
| GPT-5 | 1.79 | 0.07 | 1.34 |
| Qwen3-Max | 1.60 | 0.08 | 1.78 |
| GPT-5-Pro | 1.93 | 0.10 | 1.34 |
| GPT-5.1 | 1.85 | 0.09 | 1.57 |
| Qwen3-235B-A22B | 1.87 | 0.12 | 1.50 |
| DeepSeek-Chat-v3.1 | 1.88 | 0.09 | 1.77 |
| Gemini-2.5-Pro | 1.99 | 0.12 | 1.59 |
| DeepSeek-R1 | 1.97 | 0.16 | 2.11 |
| Qwen3-32B | 2.07 | 0.18 | 2.02 |
| Qwen3-235B-A22B-Thinking | 2.01 | 0.20 | 2.30 |
| Human Baseline | 0.95 | 0.00 | 1.01 |
Table 4: Problem-wise Mean Absolute Error by Model
| Model | P1 | P2 | P3 | P4 | P5 | P6 | Average |
|---|---|---|---|---|---|---|---|
| DeepSeek-Math-V2 | 1.68 | 0.05 | 0.11 | 1.84 | 0.07 | 0.25 | 0.67 |
| GPT-5 | 1.06 | 0.11 | 0.27 | 2.49 | 0.17 | 0.63 | 0.79 |
| Gemini-3-Pro-Preview | 1.02 | 0.25 | 0.27 | 2.57 | 0.73 | 0.48 | 0.89 |
| GPT-5-Pro | 1.06 | 0.07 | 0.66 | 2.52 | 0.53 | 0.53 | 0.90 |
| Kimi-K2-Thinking | 1.23 | 0.18 | 0.36 | 3.27 | 0.19 | 0.57 | 0.97 |
| GPT-5.1 | 1.48 | 0.14 | 0.34 | 2.98 | 0.69 | 0.61 | 1.04 |
| GPT-OSS-120B | 1.33 | 0.07 | 0.43 | 3.66 | 0.18 | 0.71 | 1.06 |
| Qwen3-Max | 1.46 | 0.07 | 0.59 | 3.73 | 0.43 | 1.02 | 1.22 |
| DeepSeek-Chat-v3.1 | 1.22 | 0.97 | 1.19 | 3.40 | 0.30 | 0.72 | 1.30 |
| Gemini-2.5-Pro | 1.13 | 0.14 | 2.09 | 3.30 | 0.75 | 0.50 | 1.32 |
| Qwen3-235B-A22B | 1.41 | 0.80 | 0.55 | 3.84 | 0.48 | 1.28 | 1.39 |
| Qwen3-32B | 2.51 | 1.64 | 1.32 | 4.66 | 1.39 | 1.63 | 2.19 |
| DeepSeek-R1 | 1.61 | 1.52 | 4.16 | 4.25 | 0.59 | 1.09 | 2.20 |
| Qwen3-235B-A22B-Thinking | 3.36 | 1.75 | 2.43 | 3.98 | 1.74 | 1.46 | 2.45 |
| Average | 1.54 | 0.55 | 1.06 | 3.32 | 0.59 | 0.82 | 1.31 |
Table 5: Problem-wise Accuracy by Model
| Model | P1 | P2 | P3 | P4 | P5 | P6 | Average |
|---|---|---|---|---|---|---|---|
| DeepSeek-Math-V2 | 0.50 | 0.95 | 0.95 | 0.30 | 0.93 | 0.77 | 0.73 |
| Gemini-3-Pro-Preview | 0.55 | 0.82 | 0.93 | 0.30 | 0.61 | 0.64 | 0.64 |
| GPT-OSS-120B | 0.34 | 0.91 | 0.89 | 0.09 | 0.82 | 0.61 | 0.61 |
| GPT-5 | 0.34 | 0.91 | 0.91 | 0.16 | 0.82 | 0.52 | 0.61 |
| Kimi-K2-Thinking | 0.39 | 0.82 | 0.89 | 0.09 | 0.84 | 0.64 | 0.61 |
| Qwen3-Max | 0.45 | 0.93 | 0.89 | 0.14 | 0.77 | 0.45 | 0.61 |
| GPT-5.1 | 0.30 | 0.86 | 0.89 | 0.14 | 0.70 | 0.50 | 0.56 |
| GPT-5-Pro | 0.30 | 0.93 | 0.82 | 0.11 | 0.59 | 0.59 | 0.56 |
| DeepSeek-Chat-v3.1 | 0.41 | 0.45 | 0.75 | 0.14 | 0.82 | 0.66 | 0.54 |
| Gemini-2.5-Pro | 0.39 | 0.84 | 0.52 | 0.18 | 0.61 | 0.57 | 0.52 |
| Qwen3-235B-A22B | 0.41 | 0.39 | 0.89 | 0.07 | 0.77 | 0.41 | 0.49 |
| DeepSeek-R1 | 0.34 | 0.41 | 0.36 | 0.14 | 0.77 | 0.57 | 0.43 |
| Qwen3-32B | 0.26 | 0.18 | 0.68 | 0.14 | 0.61 | 0.43 | 0.38 |
| Qwen3-235B-A22B-Thinking | 0.27 | 0.18 | 0.61 | 0.11 | 0.52 | 0.48 | 0.36 |
| Average | 0.37 | 0.69 | 0.78 | 0.15 | 0.73 | 0.56 | 0.55 |
6. Models & Dataset
Below are the models and dataset information referenced in this document.
6.1 Models
We select 14 models in our experiments which are: GPT-5, GPT-5 Pro, GPT-OSS-120B, Gemini-2.5-Pro, Qwen3-Max, Qwen3-235B-A22B-Instruct, Qwen3-235B-A22B-Thinking, Qwen3-32B, DeepSeek-R1, DeepSeek-Chat-v3.1, Kimi-K2-Thinking, DeepSeek-Math-V2, GPT-5.1, Gemini-3-Pro-Preview. DeepSeek-Math-V2 is deployed locally on 8xH200 GPUs from Hyperbolic and for other models we use APIs from OpenRouter.
6.2 Dataset
We use the MathArena–USAMO (2025) dataset for all experiments.
Overview
- Total samples: 264
- Source: 6 problems from USAMO 2025
- Response format: Long-form, proof-style responses
- Grading: Each sample is graded by 2 human judges:
points_judge_1: Primary ground truth used for all evaluations
points_judge_2: Reference for human baselines (see Tables 2 and 3)
- Rubric: Extracted from
grading_scheme_descwithingrading_details_judge_1
Source
- Original dataset: HuggingFace – MathArena/usamo_2025_outputs
- Version used: We retained the version prior to the October 17 update for consistency across all experiments.
6.3 Prompt
Our default prompt is available at prompt link and is used across all experiments.
6.4 Reproducibility
- Code repository: GitHub
- Run logs: Complete logs are available at Logs
Note: Exact reproduction of results may not be possible due to:
- API provider variability
- Stochasticity from
temperature=0.1
We provide full run logs for reference to support transparency and reproducibility.
Authors
Tianzhe Chu*¹², Jiaxin Zhang*¹³, Zhenyu Liao⁴, Qiuyu Ren⁵, Tahsin Saffat⁵, Zitong Yang⁶, Yi Ma²⁵, Yue Zhang*¹
*Core contributors
Affiliations
¹ Hyperbolic Labs ² University of Hong Kong ³ California Institute of Technology ³ Nanjing University ⁵ University of California, Berkeley ⁶ Stanford University
Citation
Please cite us as:
@article{chu2025gausseval,
  author = {Chu, Tianzhe and Zhang, Jiaxin and Liao, Zhenyu and Ren, Qiuyu and Saffat, Tahsin and Yang, Zitong and Ma, Yi and Zhang, Yue},
  title = {GAUSS Eval: Human-LLM Judge Consistency Analysis},
  year = {2025},
  journal = {GAUSS Blogs},
  note = {https://gaussmath.ai/eval.html}
}